IBM SPSS Visualization Designer
Charting your course just got easier
- Overview
- Features and Benefits
- System Requirements
Easily create and share compelling visualizations that better communicate your analytic results.
Easily develop and build new visualizations - from basic, simple charts to advanced, highly customized graphs - that enable new ways to portray and communicate analytic results to others. With IBM® SPSS® Visualization Designer, you don’t need graphical programming skills to conceive, create and share compelling visualizations.
- Get started right away with dozens of built-in visualization templates
- Use a powerful visual designer for "drag-and-drop" graph creation
- Extend the capabilities of built-in templates or create your own
- Share style sheets and graph templates across your enterprise
- Work with a wide array of data sources including: delimiter-separated, IBM SPSS Statistics data files, and common database sources such as: DB2®, SQL Server™, Oracle® and Sybase®

IBM SPSS Visualization Designer can create graph templates that are usable in several IBM SPSS software products. This saves time for template consumers while enabling them to present results in clear and compelling ways. With this product, you’ll enjoy:
Drag-and-drop ease of use
IBM SPSS Visualization Designer features powerful "drag-and-drop" graph creation that requires no graphical programming skills.
Built-in templates
Get started right away with dozens of built-in visualization templates. Then use IBM SPSS Visualization Designer to extend the capabilities of these templates, or come up with your own.
Enterprise-wide deployment
Use style sheets and graph templates to conform to, or modify, standards across your enterprise. Then deploy graphs in operational systems using IBM SPSS Collaboration and Deployment Services, IBM SPSS Statistics and IBM SPSS Modeler.
Here are some graph examples that can be created with IBM SPSS Visualization Designer.
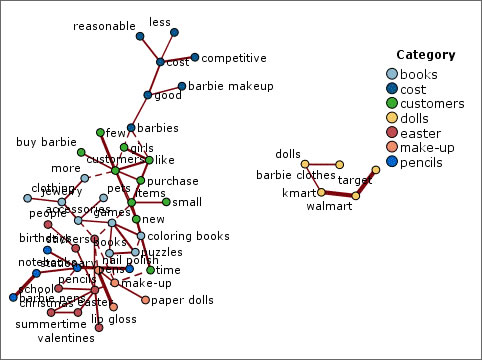
Network graph
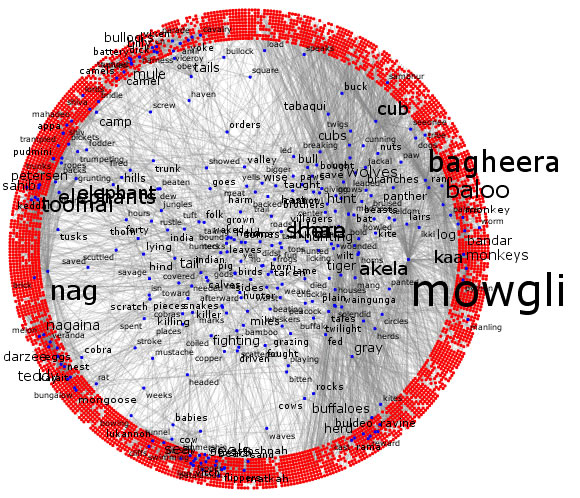
Jungle Book graph
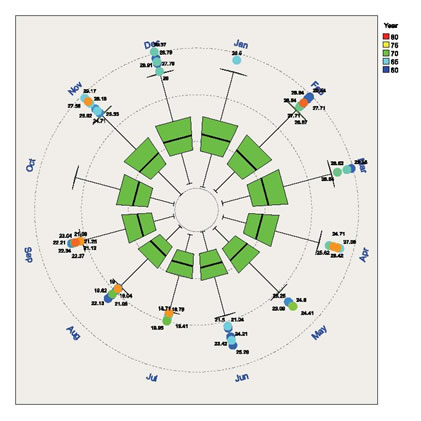
Scatterplot matrix
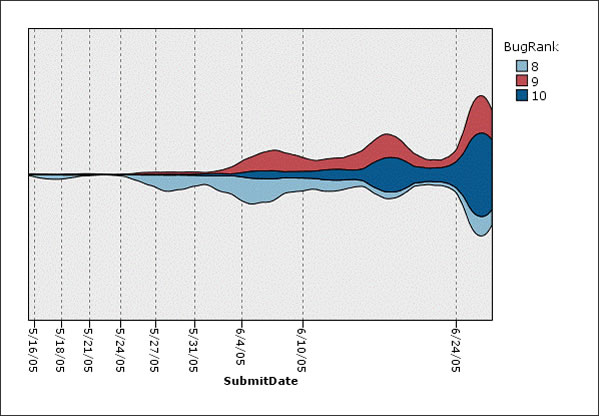
Wave graph
IBM SPSS Visualization Designer runs on the Microsoft Windows® platform. For detailed specifications, download the specification sheet. Minimum system requirements include:
- Operating system: Microsoft® Windows® 7 Enterprise and Professional (32- and 64-bit); Windows Vista® Enterprise and Business (32- and 64-bit) SP1; or Windows® XP Professional (32- and 64-bit) SP3
- Processor: Intel® Pentium®-class; 1.8 GHz or higher
- Monitor: 1024 x 768 (SVGA) resolution
- Memory: 512MB RAM minimum; 1GB or more recommended
- Free drive space: 250MB minimum; more recommended
- CD-ROM drive (for installation)
- Internet Explorer 7 or later (for online help)