

|
10 Really good reasons to use SPSS instead of just a spreadsheet to analyze data |
|
Save tons of time Import data with a few clicks. The Database Wizard guides you through importation from many type of data sources, including spreadsheets and databases, without the need for modification or re-entry of data. |
|
Use unlimited data The typical spreadsheet grinds to a halt at a million rows of data (if not much less). SPSS manages millions of rows effortlessly, so you will never again have to bread up your data and analyze it piecemeal. |
|
Eliminate costly sorting jumbles Spreadsheets are prone to sorting errors. SPSS, however, acts like a database and creates an ID for each record. This eliminates duplicate records and jumbled cases. To sort, just right-click and select. |
|
Forget about formula errors Spreadsheet functions depend on the user’s math knowledge. At the same time, they make it very easy to copy a formula over needed data, or create erroneous formulas when inserting rows or columns. In SPSS, there are no formulas to input. And since SPSS separates the results from the data, you are never in danger of corrupting results as you explore your data. |
|
Automate tasks Tired of moving and resetting formulas every time the weekly or monthly report is needed? SPSS lets you easily automate each report (or analysis or chart) and save it to your menu items. You update the report with a single click. You can also automate export to Excel® or Word format for end-users who don’t have SPSS. |
|
Use advanced techniques, easily It’s crucial that business decisions be based on reliable data insights. SPSS has measures of significance that allow confident, actionable conclusions. Its broad array of analytical techniques lets you drill down into the data to discover subtle relationships that a spreadsheet would never catch. SPSS Stats Coach helps you choose the right technique and understand what the results mean. |
|
Wow them (and yourself) with amazing visualizations, charts, and graphs SPSS makes it easy to explore your data visually with over 50 built-in chart types to choose from. It goes beyond standard business charts with boxplots, Pareto, stem-and-leaf, and many more. Quickly create, edit, and customize charts as you go, and create tables in seconds with SPSS’ easy drag-and-drop interface. |
|
Use English, not numeric code SPSS’ spreadsheet-style Data Editor shows you words (labels) in place of numeric values (such as 1 for male, 2 for female, etc.) while using the code to run calculations. You don’t have to rack your brain trying to remember what the variable represents. It’s right there in plain English. Or click on the variable for pop-up info. |
|
Get REAL help in the learning curve Most spreadsheet “help” just tells you how to perform a task. SPSS has a Stats Coach and case studies with examples from a variety of businesses. You learn when a particular analysis is used, and how to interpret the results. |
|
Get REAL help in the learning curve Most spreadsheet “help” just tells you how to perform a task. SPSS has a Stats Coach and case studies with examples from a variety of businesses. You learn when a particular analysis is used, and how to interpret the results. |
|
Use the Chart Builder to easily create a variety of commonly used charts, such as scatterplot matrices (shown here), histograms, and population pyramids. This highly visual chart creation interface enables you to create a chart by dragging variables and elements onto a chart creation canvas. |
|
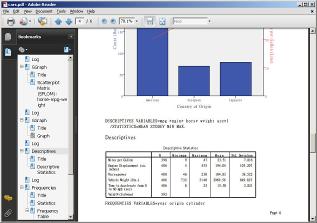
In SPSS you can create an overlay chart with two independent Y axes based on different scales. The chart above uses a different element on each Y axis: a bar showing count and a line showing mean miles per gallon, plotted against country of origin on the X axis—all in one frame. |
|
Export SPSS reports as PDF documents, making it even easier to share results with others. |
|
SPSS helps you make better, faster decisions, giving your organization a significant competitive edge. |
|
So why wait? Contact SPSS Hong Kong at ( 28119662 * spsshk@spss.com.hk |
|
Copyright © 2009, SPSS Inc. All rights reserved. SPSS (Hong Kong) Ltd. 1804, 18/F, Westlands Centre, Westlands Road, Quarry Bay, Hong Kong Tel: (852) 2811 9662 Fax: (852) 2811 3042 Email: spsshk@spss.com.hk Website: www.sbas.com.hk |

|
SPSS for Windows® is one of the leading statistical and data management software packages for analysts and researchers worldwide. |