Estimation With Missing Values Application
In this example, a missing-at-random mechanism causes values of the dependent variable to be missing. Use of ordinary regression leads to biased estimation, while use of Amos leads to better estimates.
For a sample size of 400, consider two standardized variables, X and Y, that are correlated at 0.6. The equation relating X to Y is:
Y = 4 + 0.6*X + error
Next, suppose that some observations on Y are missing. The mechanism for whether or not Y is missing or observed is a "missing at random" mechanism:
compute ind=0.
compute u=uni(10).
if ( (x > 0) and (u < 4) ) ind=1.
compute ymiss=y.
if (ind=1) ymiss=-999.
That is, whether or not Y is missing is contingent on the value of X. If X is negative, Y is complete, and if X is positive, there is about a 40 percent chance that Y is randomly missing. The resulting dependent variable is called YMISS.
The descriptive statistics for X and YMISS are shown below.
Note that X has 400 observations, a mean of 0, and a standard deviation of 1, while YMISS has 331 non-missing observations.
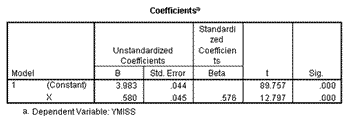
Suppose you regress YMISS on X. Here are the regression results.
The descriptive statistics for X and YMISS are shown here.
You can specify regression in Amos as follows.
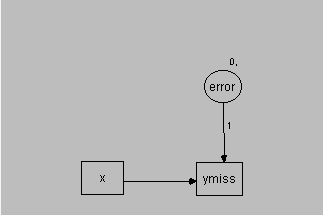
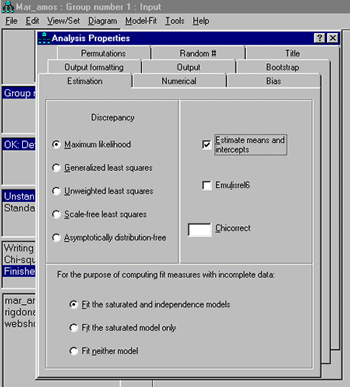
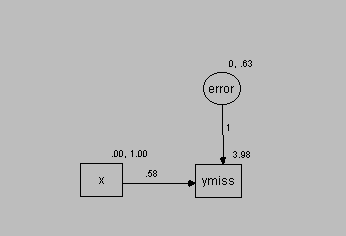
X and YMISS are both observed, while the regression error term is unobserved. The parameter value from the error term to YMISS is set to 1, while the parameter for the path from X to YMISS is to be estimated. In Amos, select View/Set Analysis Properties, select the estimation tab, and check "Estimate means and intercepts."
When Amos reads the data file, it will encounter missing data and automatically use full information maximum likelihood estimation.
Here is the un-standardized Amos solution.
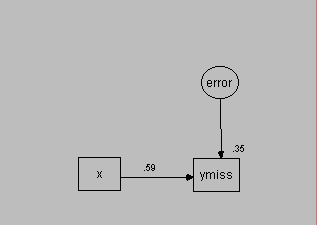
Here is the standardized Amos solution.
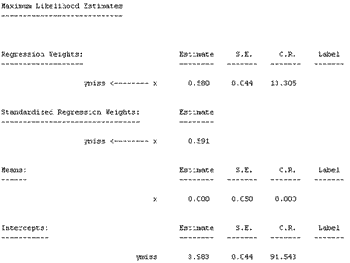
Finally, here is some Amos text output.
Amos estimates the intercept as 3.983, or almost 4, and estimates the standardized regression coefficient as 0.591, or almost 0.6.

