Customer Loyalty Model Application
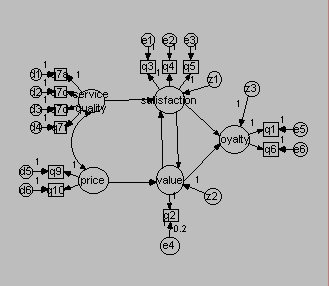
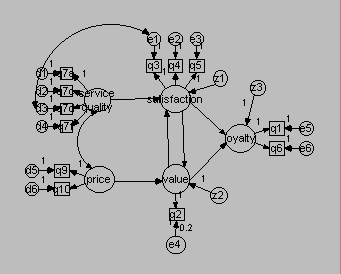
The structural part of this Amos model involves five latent variables: service quality, price, satisfaction, value, and loyalty. You can tell that these variables are latent variables because they appear as ovals. The arrows show dependencies in the model. A double-curved arrow, such as that between service quality and price, indicates that two variables co-vary. A single-headed arrow, such as that between service quality and satisfaction, indicates that the variable receiving the arrowhead, satisfaction, depends on the variable from which the arrow originates, service quality. In sum, the model posits the following dependencies:
- Service quality and price co-vary
- Satisfaction depends on service quality, value, and a random noise factor
- Value depends on price, satisfaction, and a random noise factor
- Loyalty depends on satisfaction, value, and a random noise factor
In the model specification, notice the absence of certain effects. For example:
- There is no direct dependency between satisfaction and price
- There is no direct dependency between value and service quality
- There is no direct dependency between loyalty and either service quality or price
The measurement part of the model depicts how the latent variables are measured by observed variables. For example, service quality is measured by four questionnaire items labeled Q7a, Q7c, Q7d, and Q7f. You can tell that the questionnaire items are observed variables because they appear as rectangles. While the source for this example gives no information on the exact text of the questions, these items could be agree-disagree rating items such as the following SERVQUAL items:
- XYZ company has up-to-date equipment
- XYZ's physical facilities are visually appealing
- XYZ's employees are well dressed and appear neat
- Employees of XYZ are not always willing to help customers
As the arrowheads indicate, each measure is a dependent variable, dependent on its associated latent variable and an error term.
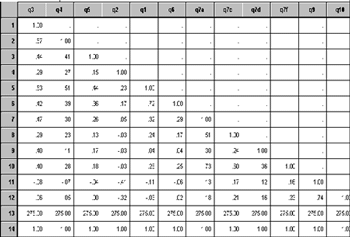
The data input to the analysis in this instance is a correlation matrix based on 275 observations.
The researcher expects that:
- Value and quality will both have positive effects on satisfaction
- Satisfaction will have a positive effect on value, and price will have a negative effect on value
- Satisfaction and value will both have positive effects on loyalty
Amos presents a set of icons for frequent tasks.

To estimate the model shown above, click the abacus icon.
Amos presents dozens of model fit statistics; here is a small excerpt.
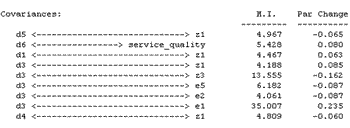
A Chi-square of around 98.5 on 48 degrees of freedom has a small p-value indicating some lack of fit. This result, coupled with examination of other fit statistics not shown, leads the researcher to consider ways to improve the model. While the researcher should not go on "fishing expeditions," inspection of modification indices shows that adding a covariance between the error terms for Q3 and Q7d will improve the fit.
It could be that these two measures have either substantially more or substantially less in common with each other than the tested model allows.
Here is the model with the added path.
The researcher uses Amos to estimate the model, and produces model fit statistics including the following:
Adding the covariance reduces the Chi-square fit statistic to 60.227 on 47 degrees of freedom, with an associated p-value of around 0.09. The change in the Chi-square between the two models is about 38 with one degree of freedom for the difference.
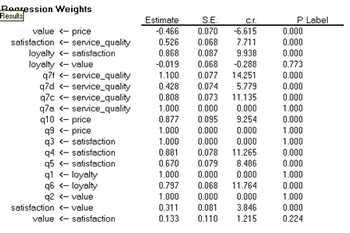
Here are the un-standardized regression weights for paths in the model, along with standard errors, critical ratios, and p-values.
The dependencies between the latent variables are, for the most part, of the same sign as hypothesized. Four of the six path coefficients are statistically significant.
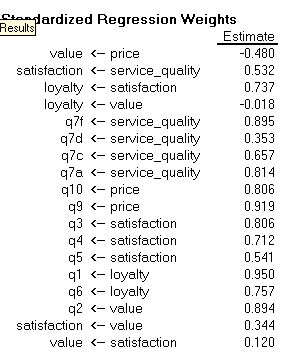
Here are the accompanying standardized regression weights.
In order of magnitude:
- Satisfaction has a positive effect on loyalty (0.737)
- Service quality has a positive effect on satisfaction (0.532)
- Price has a negative effect on value (-0.48)
- Value has a positive effect on satisfaction (0.344), but the reciprocal link from satisfaction to value is not statistically significant
- The path from value to loyalty is not statistically significant
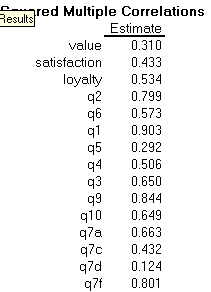
- The squared multiple correlation for loyalty is 0.534
Credit for the example goes to Ed Rigdon and his chapter on Structural Equation Modeling in Marcoulides, G.A. (editor). 1998. "Modern Methods for Business Research." New Jersey: Lawrence Erlbaum Associates.
